A strong business strategy is like the game of chess, where KPIs make every move easy.
No doubt, in this competitive world, standing out is difficult.
But what if you have a business strategy that makes it possible?
Decisions that can mean the difference between thriving and merely surviving. But how can you ensure your choices are the right ones?
The answer lies in the numbers and, more specifically, in the world of Key Performance Indicators (KPIs).
We have covered the top five Key Performance Indicators for you so that you can not only reveal the past but also project the future of your business.

Whether you are an experienced entrepreneur improving your strategies or a beginner who wants a successful business journey, this blog post is your guide to growth.
Let’s embark on this KPI journey.
What Does KPI Stand For In Accounting?
So, what are KPIs in finance?
Imagine going on a journey where you can check the distance traveled, your exact location, and how much fuel you have used. So, these are the ‘key indicators’ of how your journey is progressing.
Similarly, Financial KPIs track your business’s financial health and performance.
They provide real-time insights into critical areas. These indicators are your tools for assessing whether you’re heading in the right direction or need to make adjustments.
Financial KPIs typically link to your business goals and objectives. They give you a clear understanding of how well your company is doing in revenue, profitability, liquidity, and efficiency.
By focusing on the right financial KPIs, you can make informed decisions, track progress, and ultimately steer your business toward its goals.
Importance Of Financial KPIs
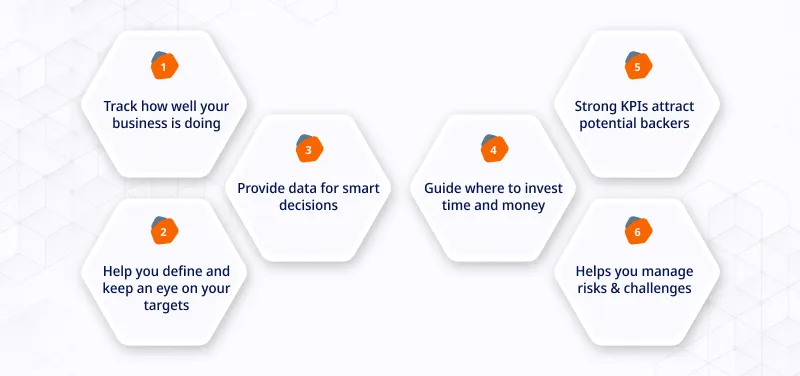
Let’s know why Financial KPIs are so important.
1. Performance Measurement
Financial KPIs offer a clear and quantifiable view of your business’s health that helps you to understand how well you’re doing in various critical areas.
Whether it’s tracking revenue, assessing profitability, or monitoring cash flow, these metrics can be beneficial to measure your success or areas needing improvement.
2. Goal Setting and Monitoring
Setting objectives and goals is a fundamental aspect of any business strategy. Financial KPIs align perfectly with this process.
They allow you to establish measurable targets and track progress toward those goals.
For instance, if your objective is to increase revenue by 15% this year, “Revenue Growth” helps you find how to do this.
3. Informed Decision-Making
Better decisions only lead to successful businesses. Effective financial data management ensures that these insights are accurate, timely, and actionable. And you can make these decisions with the data and insights these financial KPIs provide.
For instance, if you notice a declining “Profit Margin” KPI, it may prompt you to re-evaluate your pricing strategy or cost structure. By understanding the numbers, you can adapt quickly and effectively.
4. Resource Allocation
Resource allocation is a significant challenge for businesses of all sizes. Financial KPIs help you determine where to allocate resources effectively.
If a particular product or service line has a high-profit margin and strong revenue growth, it might warrant additional investment, while those lagging behind could be reconsidered.
5. Investor Confidence
Investors and stakeholders review financial health and market insights for due diligence closely. When you can demonstrate consistent growth in revenue and profit margins, you’re likely to boost investor confidence.
This can increase investments, better stock performance, and more growth opportunities.
6. Risk Management
Businesses are not immune to economic uncertainties and market fluctuations. Financial KPIs serve as early warning systems.
For instance, a sudden dip in cash flow could signal potential cash flow problems. You can proactively address these issues and minimize risks by identifying them early.

Below is the List of Top 5 Financial KPIs
a. Revenue Growth

Revenue Growth is the growth in the total income of a company in a specific period, a fiscal quarter, or a year.
It is generally a percentage that provides insights about an increase in a business’s sales and customer base.
This KPI shows the growth rate of a business’s top-line revenue, or the entire amount of money made from its main activities before costs are subtracted.
How To Calculate?
The formula for calculating Revenue Growth is as follows: Here are the steps explained to calculate revenue growth:
- Subtract the previous year’s revenue from the current year.
- Divide the resulting revenue by the previous year’s revenue.
- Multiply the result by 100 to find the percentage.
For example, if a company’s previous year revenue is = $1 million
And current year revenue = $1.2
Revenue Growth will be as follows:  Revenue Growth percentage from the above example is 20%. It means the company is growing.
b. Profit Margin

Profit margin is a financial KPI that assesses a company’s profitability by measuring the percentage of profit a business earns from its total revenue.
Keeping it simple, profit margin tells how efficiently a company converts its sales into actual profits.
It is a crucial metric to evaluate your organization’s financial health and performance.
The profit margin is written as a percentage and is calculated using the below formula:
- Net Profit is the difference between the total revenue and all expenses, including cost of goods sold, taxes, and other expenses.
Types of Profit Margins
Gross Profit Margin: The measure of profit from a company’s core operations after deducting the total cost of goods sold.
Operating Profit Margin: It calculates the profitability of a company’s core operations; it considers all operating expenses except interest and taxes.
Net Profit Margin: It accounts for all company expenses, including taxes and interest. It provides a whole picture of a company’s overall profit.
Interpreting Profit Margins
Interpreting profit margins depends on the industry and the company’s specific circumstances.
A higher profit margin is generally desirable, but it’s essential to consider industry benchmarks and business objectives.
Some industries naturally have lower profit margins due to higher operational costs.
c. Cash Flow

Cash Flow is the net cash that moves in and out of a business during a particular period, say a month, quarter, or year.
It provides a complete view of how an organization manages its liquidity.
Have a look at the key components of cash flow:
Operating Cash Flow: Cash generated or used in core operational activities of a company, like sales and expenses.
Investing Cash Flow: Cash used for investment activities, including purchasing assets (like equipment or real estate) or selling investments.
Financing Cash Flow: Cash related to financing activities, such as borrowing or repaying loans, issuing or buying back shares, and paying dividends.
How To Calculate?
Here’s how you can calculate Cash Flow:

Positive cash flow: The company earns more than it spends. Good sign.
Negative cash flow: The company loses money faster than it makes it. Worrying.
Cash flow tells if a company can pay bills and stay stable. It is vital for investors, managers, and owners.
d. Return on Investment

Return on Investment KPI (ROI) is the key performance indicator used to determine the profitability as well as effectiveness of an investment.
It estimates the profit or loss concerning the initial investment of funds. Businesses may evaluate the returns on various investments, whether in marketing, projects, assets, or any other area, thanks to ROI’s expression as a percentage.
ROI is a critical KPI because it provides valuable insights into the performance of investments.
How To Calculate?
Calculate the ROI with the below formula:

Follow these steps for calculation:
- Firstly, calculate the net gain; net gain is the total sum of money you make from your investment, including any savings, income, or other gains.
- Secondly, determine the investment cost, which is the whole cost of the investment, including setup, marketing, and purchasing costs.
- Divide the net gain by the initial investment cost. Multiply the result by 100 to obtain ROI %.
For example, if an organization invests $10,000 in a marketing campaign and generates an additional $15,000 in revenue, the ROI will be:

Thus, the Return on Investment is 50%.
e. Working Capital

Working capital KPIs are the most important KPIs and are the lifeblood of any company’s business operations.
It is the difference between an organization’s current assets and liabilities.
- Current assets include cash, accounts receivable (AR), and inventory, while current liabilities are debts, accounts payable (AP), and other dues within a year.
Simply put, working capital is the money a business can use immediately for short-term expenses like bills, inventory, and employee salaries.
The formula for calculating Working Capital is:

Interpreting Working Capital
A positive working capital indicates that a business has more assets than liabilities, providing a financial cushion to handle day-to-day expenses and uncertainties.
Conversely, a negative working capital suggests a potential liquidity problem, which can lead to difficulties in meeting immediate financial obligations.
Working capital is not a one-size-fits-all metric; its ideal value varies by industry, business size, and stage of development.

Challenges and Common Pitfalls
Let’s explore some of these challenges:
Misinterpreting Data
Common misinterpretations include:
Focusing Solely On Numbers: Paying too much attention to data alone without considering the bigger picture and underlying factors.
Ignoring Seasonality: Not accounting for seasonality or cyclical patterns can result in distorted interpretations.
Ignoring Leading Indicators: Relying too heavily on past data (lagging indicators) without factoring in predictive metrics (leading indicators) can make your strategy reactive rather than proactive.
Setting Unrealistic Targets

Unrealistic targets can lead to:
Demotivation: When employees consistently fall short of unattainable targets, it can lead to demotivation and decreased morale.
Risk-Taking: To meet unrealistic targets, there’s a temptation to take unnecessary risks, which can result in financial instability.
Short-Term Focus: Unrealistic targets may encourage focusing on short-term gains without considering long-term sustainability.
Reviewing and adjusting these targets helps balance ambition and feasibility.
Neglecting Non-Financial KPIs
Common issues related to neglecting non-financial KPIs include:
Inadequate Customer Insights: Focusing entirely on financials can lead to a lack of understanding of customer needs and preferences.
Employee Turnover: Ignoring employee satisfaction and engagement can result in higher turnover rates.
Environmental and Social Responsibility: Neglecting non-financial KPIs related to sustainability and social responsibility harms your reputation.
By being aware of these challenges and common pitfalls, you can better navigate the world of Financial KPIs and integrate them into your business strategy more effectively.
How To Use Financial KPIs In Business Strategy
Here’s how you can use Financial KPIs in your business strategy:
1. Setting Objectives and Goals
- The first step in utilizing Financial KPIs is to align them with your company’s objectives. What do you want to achieve, and how do financial KPIs support these goals?
- Set clear, specific targets for each financial KPI. These targets should be realistic, measurable, and time-bound.
- Review and update your KPIs periodically to ensure they remain relevant to your evolving strategy.
2. Monitoring Performance

- Regularly monitor these metrics to track performance. Utilize reporting tools and dashboards to make this process more efficient.
- Compare them with historical data, industry benchmarks, or competitors’ performance. This comparative analysis helps you gain a more comprehensive view of your company’s standing.
- Spotting trends in your financial KPIs is crucial. Are they consistently improving, remaining stable, or showing a decline?
3. Making Informed Decisions
- When faced with strategic choices, rely on the insights provided by your KPIs.
For example, if you notice a drop in profitability, your decision might involve cost-cutting measures or price adjustments.
- If a KPI shows financial instability, like an increase in debt, you should immediately mitigate these risks.
- When you know the areas of your business performing well and which need improvement, you can allocate resources more effectively.
4. Adapting And Adjusting Strategy
- If a KPI indicates a deviation from your goals, be prepared to adjust your strategy. This might involve changing tactics, reallocating resources, or redefining your objectives.
- Embrace a mindset where you and your team constantly seek ways to enhance performance based on KPI insights.
- As you monitor, make decisions, and adapt, the feedback from your KPIs helps refine your strategy over time.
From goal setting to decision-making, monitoring performance to adjusting your strategy, KPIs are your compass in the ever-changing sea of business.
Tools and Software for Tracking Financial KPIs
When tracking and managing your Financial Key Performance Indicators (KPIs) effectively, the right tools and software can make all the difference.
Below are some options to stay on top of financial data.
A. Spreadsheet Software
For a while now, people in small and medium-sized businesses have liked using spreadsheet software to monitor their financial KPIs.
Microsoft Excel & Google Sheets are the two prevalent choices. They’re popular because they’re flexible and easy to use.
You can make your spreadsheets to put in and check your financial info. But remember, while they’re handy, they might not be great for tasks requiring a lot of automation and scalability.
B. Accounting Software
Accounting software is designed to ease financial processes, making it an excellent choice for tracking KPIs.
Numerous accounting software solutions are available, but one notable option is Invoicera.
![]()
Invoicera offers features like expense management, time tracking, and project management, making it a one-stop solution for businesses. Have a look:
Key features of Invoicera:
- Financial Reporting: You can create detailed financial reports to monitor KPIs and financial performance.
- Expense Tracking: Track and manage expenses to control costs and improve financial health.
- Automated Invoicing: Generate and send invoices to clients and customers effortlessly.
- Integration: Invoicera integrates with various payment gateways and your business tools, making financial processes easier.
Invoicera is a versatile tool for businesses looking to track financial KPIs and improve overall financial management efficiency.
C. Business Intelligence Tools
Business Intelligence tools could be an option for more advanced and in-depth financial analysis. These tools collect, analyze, and visualize data, including your financial KPIs, and provide actionable insights. Popular BI tools include Tableau, Power BI, and QlikView.
Whether you opt for spreadsheet software, accounting software like Invoicera, or advanced BI tools, these resources are paramount for making data-driven decisions and shaping a successful business strategy.
Final Words
Ending up the thoughts with the below key takeaways of whatever we have discussed above.
- Making the best use of these KPIs can take your business in the right direction and lead you towards success.
- Net Profit Margin and ROI are the most fundamental KPIs that effectively show the profit of your business.
- These KPIs give you a complete idea about how to use your resources so that you are not in debt.
Thus, remember the importance of these KPIs, as you can drive your business forward by making the best decisions using them.

FAQs
Are these financial KPIs relevant to all types of businesses?
Generally, all the KPIs are applicable for all business types. But, for better specifying, you can always consider your business goals. Some industries may prioritize certain KPIs more than others
Can these financial KPIs help in long-term business planning?
Yes, KPIs can help you in long-term business planning. With a better understanding of KPIs, you can plan your future success.
How often should I track and update my financial KPIs?
The frequency of tracking depends on particular KPIs and your unique business requirements. For example, Revenue Growth KPI can be tracked monthly, while ROI can be quarterly or yearly.
What is the amount a business earns after deducting what it spends for salaries and other expenses?
The amount a business earns after deducting what it spends for salaries and other expenses is referred to as net income or profit. Net income is calculated by subtracting total expenses, including salaries, rent, utilities, and other operational costs, from the total revenue generated by the business.